

-
MT5使用技巧
图表的个性化定制
您可以通过加载一些指标、网格和时期分隔线来个性化地定制您的图表,同时也可以根据需求添加或移除这些部件。
隐藏卖出价格线
如果您添加了大量技术分析的指标或线条,卖出价格线可能会在图表上显得有点多余。您可以通过将价格线设置为「None」来将它彻底从图表上移除。
设置默认图表
一旦您设置好了一个非常满意的图表,您可以将它保存为模板。最为快捷方便的模板设置方式是,直接在图表上单击鼠标右键,选择「模板」——「保存模板」。您可以设置多个模板以满足不同交易策略的分析需要。
如果您想将最常用的模板设置为默认图表的模板,您可以在图表上单击鼠标右键,选择「模板」——「保存模板」,然后将模板命名为「Default」。
财经日历
那么,我们该如何对这些潜在的市场推动因素保持关注?尽管我们无法预知世事,但我们可以通过财经日历来监测哪些重要的新闻发布将在未来几天、几周或几个月里进行。
财经日历列出了特定国家公开发布的新闻和事件,这意味着世界各地的人们可以同时获悉同样的新闻。尽管这对我们这样的零售交易者来说是个重大利好,但最好能意识到银行也有一个主要优势——他们能通过看到客户的订单流,看到资金流向哪里(以及从哪里流出)。
工具条的个性化定制——MT5平台上共有四个独立的工具条:
-常用
-图表
-画线
-周期
您可以通过简单地拖动工具条,来将它们移动到任何您想要的地方。
要个性化地定制您的视窗,只需要在工具条上单击鼠标右键,然后点击「定制」菜单。这里您可以通过选择不需要的功能,并点击「移除」按钮来完成功能移除操作。
通过在每个工具条的右键菜单上选择「定制」,您可以移除不需要的工具,并查看到一些被隐藏的工具。通过上述操作,您将可以得到一个更简洁、更紧凑的用户界面。
使用快捷键
键盘快捷键是一种简单快捷的任务执行办法。通过使用快捷键,您可以更快地使用各种工具——长期来看,这将为您节省不少时间。您可以删除冗余的信息和功能,更重要的是,增加您的图表空间。
以下键盘快捷键能帮助您更快地在平台上打开或关闭各种视窗:
终端
Control+T
这是您交易时会用到的主视窗——管理持仓、查看帐户历史,以及设置警报。
导航
Control+N
添加指标、EA以及登录功能。
市场报价
Control+M
查看产品报价。
数据视窗
Control+D
查看当前图表视窗中产品的所有数据信息。
使用快捷键
在MT5平台上,当您切换图表模板时,您将失去当前图表上的所有分析。为了防止这种情况发生,您可以保持图表打开,仅仅更改您使用的指标——这时候就可以用到快捷键了。您可以为特定指标设置一个快捷键,而无需再为了添加指标而切换模板。
具体的操作方法是,在导航视窗中的指标上单击鼠标右键,选择「设置快捷键」。
指标收藏夹列表
为了简化调取常用指标的步骤,您可以为常用指标创建一个收藏夹列表。以下为您介绍如何将指标添加到您的收藏夹:
打开导航视窗(Ctrl+N);
展开相关内容的目录(技术指标、脚本等等);
将鼠标光标移动至您的任一常用技术指标上;
单击鼠标右键;
选择「添加到收藏夹」。
警报
通过警报功能,您可以跟踪重要的价格水平突破,从而及时调整您的交易和图表分析。如果您同时关注多个市场,很容易失去对其中一个或几个市场的追踪,特别是在重要新闻公布后,所有市场都以各自不同的方式运行。要设置警报功能,请将您的鼠标光标移动至您想要设置警报的图表上,单击鼠标右键,在菜单中选择「交易」——「设置警报」。
-
风险管理
注意每笔交易的风险
在决定开设一笔交易之前,您应该决定您愿意在这次交易中承担多大的风险。也即,您需要确定如果市场走势与您相悖时,您的交易止损点设在哪里。
止损点的设置取决于您的风险承受能力——作为一个交易者,您必须接受与交易相关的风险。如果您能接受潜在的亏损可能性,那么就继续开设这笔交易吧。如果您无法承受潜在的亏损,那么我们建议您暂时不要开设这笔交易,先考虑如何把交易的风险降下来。
一些交易者只愿意在任何一笔交易中承担1至3%的资金亏损。这种情况下您可以在2%的资金处画一条红线,告诉自己将不会在一笔交易中亏损超过2%的资金。也即,您应该确定您的最大风险承受程度,并在接下来的交易中坚持它。
一旦您确定了这一点,您就可以决定在何处设置您的止损价格。设置止损相当于为您的交易上一道保险,以确保您不会在一次交易中损失所有资金。但需要特别注意的是,止损并不能完全保证安全——如果市场发生价格跳空,您的交易可能不会止损在预设的价格上。
市场价格跳空指的是市场在非常短的时间内突然发生的巨大波动。
示例
假设您的帐户内有10,000澳元,您愿意拿来承受风险的资金占总资金的2%,接下来您需要计算出交易的仓位大小。在计算过程中,您所交易的货币对种类也会影响到开仓量的计算。例如,200澳元的风险资金,在交易AUD/USD时的开仓量与NZD/CAD不同——因为不同货币对的每点价值存在差异。
在澳元结算的帐户中交易1手AUD/USD
交易量= 100,000
1点= 0001
AUD/USD汇率= 0.7465
每点价值= 0.0001 / 0.7465 x 100,000 = 13.39澳元
正如您所看到的,交易不同货币对意味着货币对波动的每点价值也会有所不同——交易AUD/USD时,市场价格每波动1点所带来的资金风险是13.39澳元,而交易NZD/CAD时,相应的每点价值是10.09澳元。
要计算出您设置止损的具体价格,接下来您需要计算出在多少点的逆向波动后,仓位的累计亏损会达到200澳元。
AUD/USD——$200 / $13.39 = 15点止损
NZD/CAD——$200 / $10.09 = 20点止损
如果您想要设置一个更大的止损,那么您需要减少交易量——例如,将1标准手的交易量降低至1迷你手(10,000)
在交易1迷你手AUD/USD的情况下,您的止损可以扩大至距离开仓价格150点,而对于NZD/CAD交易,您的止损则可以扩大至距离开仓价格200点。
请记住,您的每一笔交易始终伴随着风险——请确保您充分理解您所面对的交易风险,并能够对它泰然处之。
-
如何创建交易策略
如何创建交易策略
如果您想成为一位交易者,制定交易策略是至关重要的。在这里,我们将探讨交易策略所包含的一些重要内容。
评价您的技能
您测试过您的策略了吗?您确信您的策略是有效的吗?您能毫不犹豫地遵循您的策略吗?如果您交易策略还不够完善,那么最好通过测试不断调整,直到您能放心使用您的策略。
心理准备
交易会使情绪像坐过山车一样起伏,所以努力让情绪不受干扰显得尤为重要。如果您面临个人压力而无法调节交易带来的挑战,那么最好不要进行交易。如果您在情绪和心理上都准备好了,那么您可以开始进行交易,但是请确保您的帐户内只持有一个单子。
设置风险等
当交易时,您应该设置一个能使您面对亏损处之泰然的风险等级。专业的交易者倾向把风险控制在本金的1%至5%,具体多少取决于您的交易风格和风险承受能力。
设置目标
在开始交易前,您应该设置预期盈利目标和风险回报率。做为一名交易者,您应该设置每周、周月和每年的盈利目标,并定期评价以确保您的交易策略得到有效执行。
准备交易
每个交易日在您开立第一个仓位之前,您应该先做好一些准备。比如,研究当天的主要新闻、在图表上面标示出支撑位与阻力位,甚至再次通读您的交易策略。
开仓与平仓规则
在开仓前,您应该确定要把盈利目标与止损点位设在哪里。
您应该根据自己已经测试过的交易策略所发出的信号来进行开仓。在开仓时,您的交易策略应该能准确提示您在何时、以什么价格开仓、依据的是什么指标、什么价格形态,以及不同时间级别图表上分别发生了什么。
您也应该按预设目标平仓——当市场按您的预期变动时,保留仓位以继续截获更多盈利的想法虽然看起来很诱人,但是市场也随时可能发生不利的变化。
记录所有事项
记录整体的交易表现,可以帮助您分析交易策略的有效性。如果某一时期出现亏损,交易记录也能帮助您看清楚是哪里出了问题。
需要记录的关键信息包括以下因素:
开仓价格;
平仓价格;
您最初设置的止损和获利水平;
仓位大小;
开仓原因;
交易期间的心理;
是盈利还是亏损;
开仓和平仓时图表的截图
如果您想成为一个始终如一的交易者,有一个交易策略是至关重要的——永远不要低估计划的力量。
-
常见图表形态
什麽是图表形态?
在市场中,买卖双方无时不刻在进行力量的博弈,图表是这种博弈结果的记录。人们逐渐在图表上发现了一些典型的图表形态,借助它们,人们可以清晰地看到市场上是买方占优还是卖方强势。而且,随着这些经典形态一次又一次地出现,人们发现市场上总是出现同样的买卖双方力量变化。因此,我们可以借助学习形态的经验来预测后市的走势,这就是形态分析。
典型的图表形态包括两类:反转形态和持续形态。在本篇中,我们将通过介绍三种最为常见的图表形态来理解形态分析是如何预测价格走势的,以及人们怎样通过形态分析来做出交易决策。
头肩顶和头肩底
头肩顶形态是最受交易者重视的形态之一,也是最为常见的倒转形态之一。它一般在上涨趋势中逐渐形成,并发出市况逆转的信号。也就是说,头肩顶形态的出现往往意味着一波上涨趋势的结束。
一个典型的头肩顶形态如下图所示:
当价格上涨又跌回到一个固定点位时,形成了一个峰值,样子像是左边的肩膀。价格随后再次回升,并创造了一个比前面的峰值更高的顶点,又回落到第一个峰值的支持水平,新的顶点被称为「头部」,支持水平被称为「颈线」。如果形态完全形成,价格会在颈线位置反弹并创造一个更低的峰值,也就是右边的肩膀。
当您在图表上发现头肩顶形态时,一个潜在的入场点是当价格确认跌破颈线时,也就是说,当蜡烛收盘于颈线下方时,我们在下一根蜡烛开盘时开设卖出仓位。
当您在图表上发现头肩顶形态时,一个潜在的入场点是当价格确认跌破颈线时,也就是说,当蜡烛收盘于颈线下方时,我们在下一根蜡烛开盘时开设卖出仓位。
在交易开设后,盈利目标通常设置为从头部到颈线的点数距离。
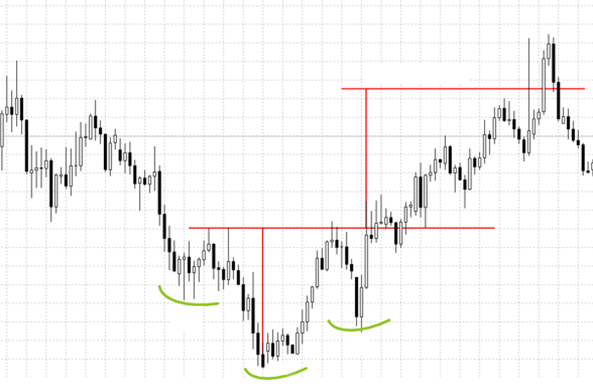
另外,也许有时候您还会碰到头肩底形态,头肩底往往出现在一波下跌趋势的末尾,并意味着未来价格上涨的可能性较大。头肩底由一个波谷,紧接着一个更低的底部和一个更高的波谷构成。与头肩顶类似,头肩底的进场时机是在确认颈线被价格突破的时候,或者等待看看颈线是否会被回测。
下图是实际市场中的头肩底形态:
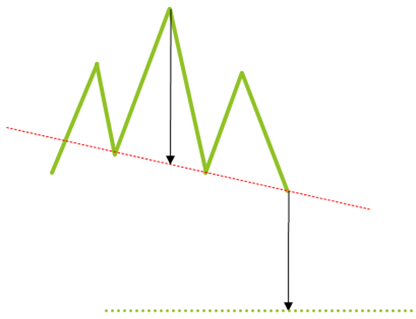
双顶和双底
双顶形态往往出现在一段上涨趋势的顶部,它也是一个倒转形态,意味着一波上涨趋势的结束。双顶形态由两个紧挨着的峰值构成,且两个峰值的价格是相近的。形态的颈线位于价格形成的支持水平。当价格跌破支持水平,也即颈线时,我们认为形态已经形成。
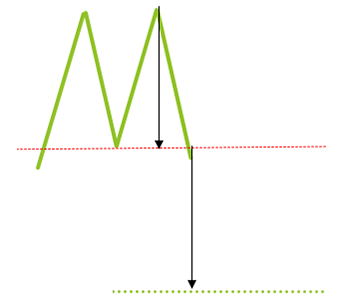
在入场时机的选择方面,一般可以考虑在价格跌破颈线时开设卖出仓位,或等待价格回测颈线失败并形成一个更低的峰值时入场,一旦回测失败,往往意味着价格向下的动力更强。
盈利目标设置在从顶部到颈线的点数距离。
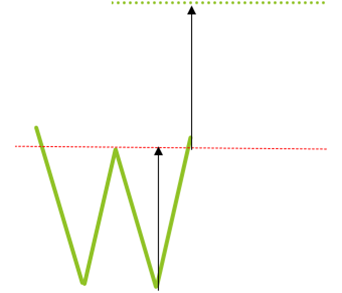
双顶形态反转过来是双底形态,它往往出现在一段下跌趋势的结尾,由两个紧挨着的低谷构成,且低谷的价格相近。双底的出现往往意味着接下来会开启上涨趋势。同样地,我们既可以在颈线被突破的时候入场,也可以等待回测颈线失败并形成一个更高的低谷时入场,回测颈线失败意味着价格向上的动力更强。
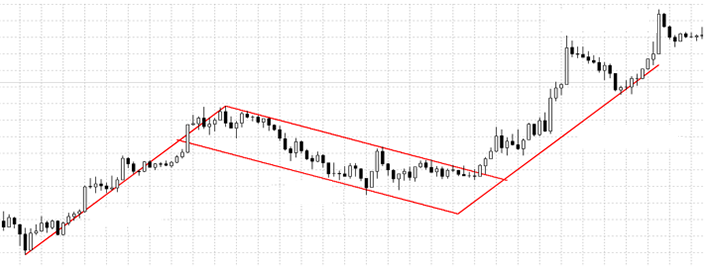
旗形
与前面介绍的头肩顶和双顶形态都不同,旗形形态是在上涨或下跌趋势中都可能出现的整理形态。由于价格不可能总是处在明确的上升或下跌趋势中,有时它会休息整理一下。这时候您会发现价格反复震荡,然后再重回到之前的趋势当中。

上图是上升趋势中的旗形,价格在盘整之前是一个上升的态势。沿着盘整轨迹的顶部和底部画平行线,就得到一个旗子的形状。:
以上图旗形趋势为例,当价格突破顶部旗形线时,您可以考虑入场开设买进仓位。或者您也可以等价格重新测试旗形线,并创造一个更高的波谷后再入场,这个更高的波谷增加了我们交易盈利的把握。
计算前面上升趋势直至底部旗形线的点数,并把它作为目标盈利点数。
下图是实际市场上升趋势中的旗形形态。在第一波上升趋势完成后,价格始终都在旗形形态中不断巩固,并最终突破顶部旗形线,开始第二波上涨趋势。
以上内容可以作为您进一步学习形态分析的入门引导,未来您会学习到更多不同种类的图表形态。
-
止损和获利
止损能帮助您减少情绪对交易的干扰,同时止损在您无法持续监控交易时也非常有用。
止损示例
假设有一个AUS200买进仓位,开仓价格是5066,止损设置在5026。当价格跌至5026时,止损会被自动执行,使得仓位在下一口可执行价格平仓。在这个例子中,仓位亏损了40点。
值得注意的是,止损并不能完全保证在您指定的价格上执行,由于市场可能会发生价格跳空,它将导致止损执行在一个不同的价格。市场价格跳空指的是市场在非常短的时间内突然发生的巨大波动。
设置多大的止损
一旦您开设一个仓位后,您就要好好考虑需要设置多大的止损。止损的设置应基于您的个人风险承受能力,但是止损点数也不能设置得太少,否则交易可能很快就被止损了——您需要给交易留一些浮动亏损的空间。一般建议您设置的止损不应让资金亏损超过1%到5%为宜。
追踪止损
每当价格朝着有利的方向移动一定点数时,追踪止损的价格也跟着发生移动。换句话说,当价格朝着有利方向移动时,追踪止损会自动「追踪」价格。这个功能能帮助您锁定利润,并自动管理您的交易。
每当价格朝着有利的方向移动一定点数时,追踪止损的价格也跟着发生移动。换句话说,当价格朝着有利方向移动时,追踪止损会自动「追踪」价格。这个功能能帮助您锁定利润,并自动管理您的交易。
盈利目标
盈利目标是一种预先设定的价格,在此价格上您将盈利平仓。在您打算开设仓位前,您应该确定您的获利价格设在哪里。盈利目标是订单管理的重要组成部分,只要市场价格达到了获利价格,您无需在电脑旁监控仓位,获利会帮助您自动平仓结利。
-
止损示例
市价单
市价单是由交易者手动开仓,并执行在当前市场的可成交价格上的订单。日内交易者和一些剥头皮交易者更倾向于开设市价单来进行交易。
挂单
挂单是有预设的开仓价格的订单,当市场达到预设价格时,挂单会自动开仓。如果您无法长时间在电脑前监视价格波动,那么挂单对您来说会非常有用。在区间交易(价格在一个区间内来回运行)和突破交易(价格突破了区间运行)两种情形下,挂单也会十分有帮助,挂单可分为两种类型。
挂单类型
-止损挂单,在比当前市价更低的价格卖出或在比当前市价更高的价格买进。
-止盈挂单,与止损挂单恰恰相反——在比当前市价更高的价格卖出,或在比当前市价更低的价格买进。
止损挂单
下图中显示了买进止损挂单(在更高的价格买进)和卖出止损挂单(在更低的价格卖出)。例如,您可以设置一个卖出止损挂单来对冲之前买单的风险,从而限制潜在的亏损。此外,止损挂单还可以被用来组建顺势交易策略(例如,您打算开设一个卖单,但是仅在市场价格确认进入下跌趋势后再入场)。

止盈挂单
下图中显示了买进止盈挂单(在更低的价格买进)以及卖出止盈挂单(在更高的价格卖出)。止盈挂单可以用来组建区间交易策略,也即当价格在区间内上下运行时,交易者可以设置止盈挂单来自动执行区间买卖交易。
止损挂单和止盈挂单是控制交易风险的好帮手。请查看WCG交易指南来了解如何在进阶策略中使用这两种挂单。 -
图表解析
读懂图表
图表是交易的核心。图表除了能帮助交易者监测仓位的实时价值,还能帮助他们了解过去的价格走势,并在此基础上提供价格未来走向的线索。因此,学会读懂图表是成为交易者的关键一步。
首先要理解的是,图表上的价格显示的是相应时间的价格表现。
时间:X轴(从左至右)
图表上的X轴显示的是时间(从左至右)。越往左边,时间越早。最新的蜡烛或价格柱代表当前的时间。每根蜡烛或价格柱代表了一单位的时间。通过图表顶部的时间周期设置栏,您可以更改一单位时间所代表的时间长短。例如,假设您将时间周期设置为每日(D1),意思是每根蜡烛或价格柱代表一天的价格波动。如果将它设置为5分钟(M5),意思是每根蜡烛或价格柱代表5分钟的价格波动。
价格:Y轴(从上至下)
您可以从垂直Y轴上读取产品的价格。蜡烛或价格柱所处的位置越高,则相应时间的价格越高。相对地,如果蜡烛或价格柱处于图表底部,代表相应时间的价格较低。
价格构成
在阴阳烛图或柱状图上,每根蜡烛或价格柱都显示了以下四种价格:
-开盘价格:这是周期开始时的第一口价格。在柱状图上,左边的水平线代表开盘价格。在阴阳烛图上,在蜡烛是上涨的情况下,烛体的底部代表开盘价格,而在蜡烛是下跌的情况下,烛体的顶部代表开盘价格。
-最高价格:周期内出现的最高价格。
-最低价格:周期内出现的最低价格。
-收盘价格:周期结束时的最后一口价格。颜色被用于区分开盘和收盘价格。
在一个周期结束时,会出现一根新的蜡烛/价格柱,过程如此往复,形成了我们看到的图表。下面是每种图表类型的图解。最常见和最基本的3种图表形式是:折线图、柱状图和阴阳烛图。尽管它们提供价格信息的形式稍有不同,但它们都遵从时间(周期)的概念。
-
卖出价、买进价与点差
点差
完整的报价由两部分组成:卖出价格和买进价格。这两者之间的差价被称为「点差」。点差实际上是经纪商或银行在您开仓时收取的费用(即交易成本)。点差越大意味着您交易的成本越高,反过来说,点差越低意味着交易费用越便宜。
交易量越大、越通用的货币,通常在交易时的点差越小,而交易量较小、不太常见的货币,往往点差都比较大。
对于交易较为频繁的交易者,例如日内交易者或短线交易者,点差大小至关重要。当然,对于中长线交易者来说,点差大小所造成的影响不大。
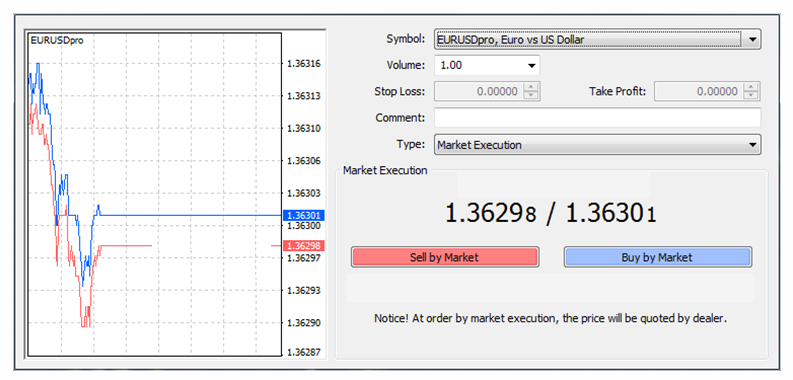
以上是MT4开仓视窗的截图,其中可以看到当时的卖出价格、买进价格和点差。当您开买单或卖单时,执行的价格会有所不同。
买单(多仓)
报价:1.36298/1.36301
买进的开仓价格是1.36301
卖单(空仓)
卖出的开仓价格是1.36298
在两种情况下,您刚开仓时的盈亏(P/L)都是负数,因为订单在开仓时被收取了点差。当市场朝着对您有利的方向波动与点差相同的点数时,您的订单将达到盈亏平衡。